Price an option in three steps
- Load a stockType any ticker with listed options and press Load. The price, rates, volatility and a normal near-the-money option are filled in for you.
- Change the recommended premiumThe model’s fair price is already in the premium box. Type a different one (or drag the slider) and watch the implied volatility, Greeks, charts and surfaces react.
- Explore the tabsGreeks, payoff, what-if P&L, the volatility surface. Every term is explained in the Guide.
Pricing models
Your premium vs the model what changes when the market price differs from the model price
Greeks
Enter a premium to see its impact
Type a premium in the Your premium box (for example a price far above what the model says). Everything here compares your model’s volatility with the volatility your premium implies.
Model vs market
How each number reacts as the premium changes
Every point on these curves re-solves the implied vol for that premium and recomputes the Greeks at it (Black-Scholes). The white dashed line is the model price at the model σ; the amber line is your premium.
Greek surface
What happens to your position?
You entered at your premium. Move the sliders to see the option’s value and your profit or loss after spot, volatility and time change.
Where the P&L comes from
Edge at entry = model value − your premium (from your side). Then the Greeks explain the move: Δ·ΔS, ½Γ·ΔS², vega·Δσ, Θ·Δt. “Other” is the higher-order remainder.
P&L heat map
Green = profit, red = loss, per share, valued with Black-Scholes. The dotted vertical line is where you are now.
Convergence to Black-Scholes-Merton
European tree error shrinks roughly like 1/steps (with a saw-tooth from how the strike sits on the lattice). The American curve sits above it by the early-exercise premium.
Early-exercise boundary
Pipeline: log-moneyness k = ln(K/S) → OTM quotes → Black-Scholes implied vols → Savitzky-Golay smoothing per expiry → two-stage PCHIP interpolation (strike, then total variance in time). The red dashed line marks at-the-money.
Python render
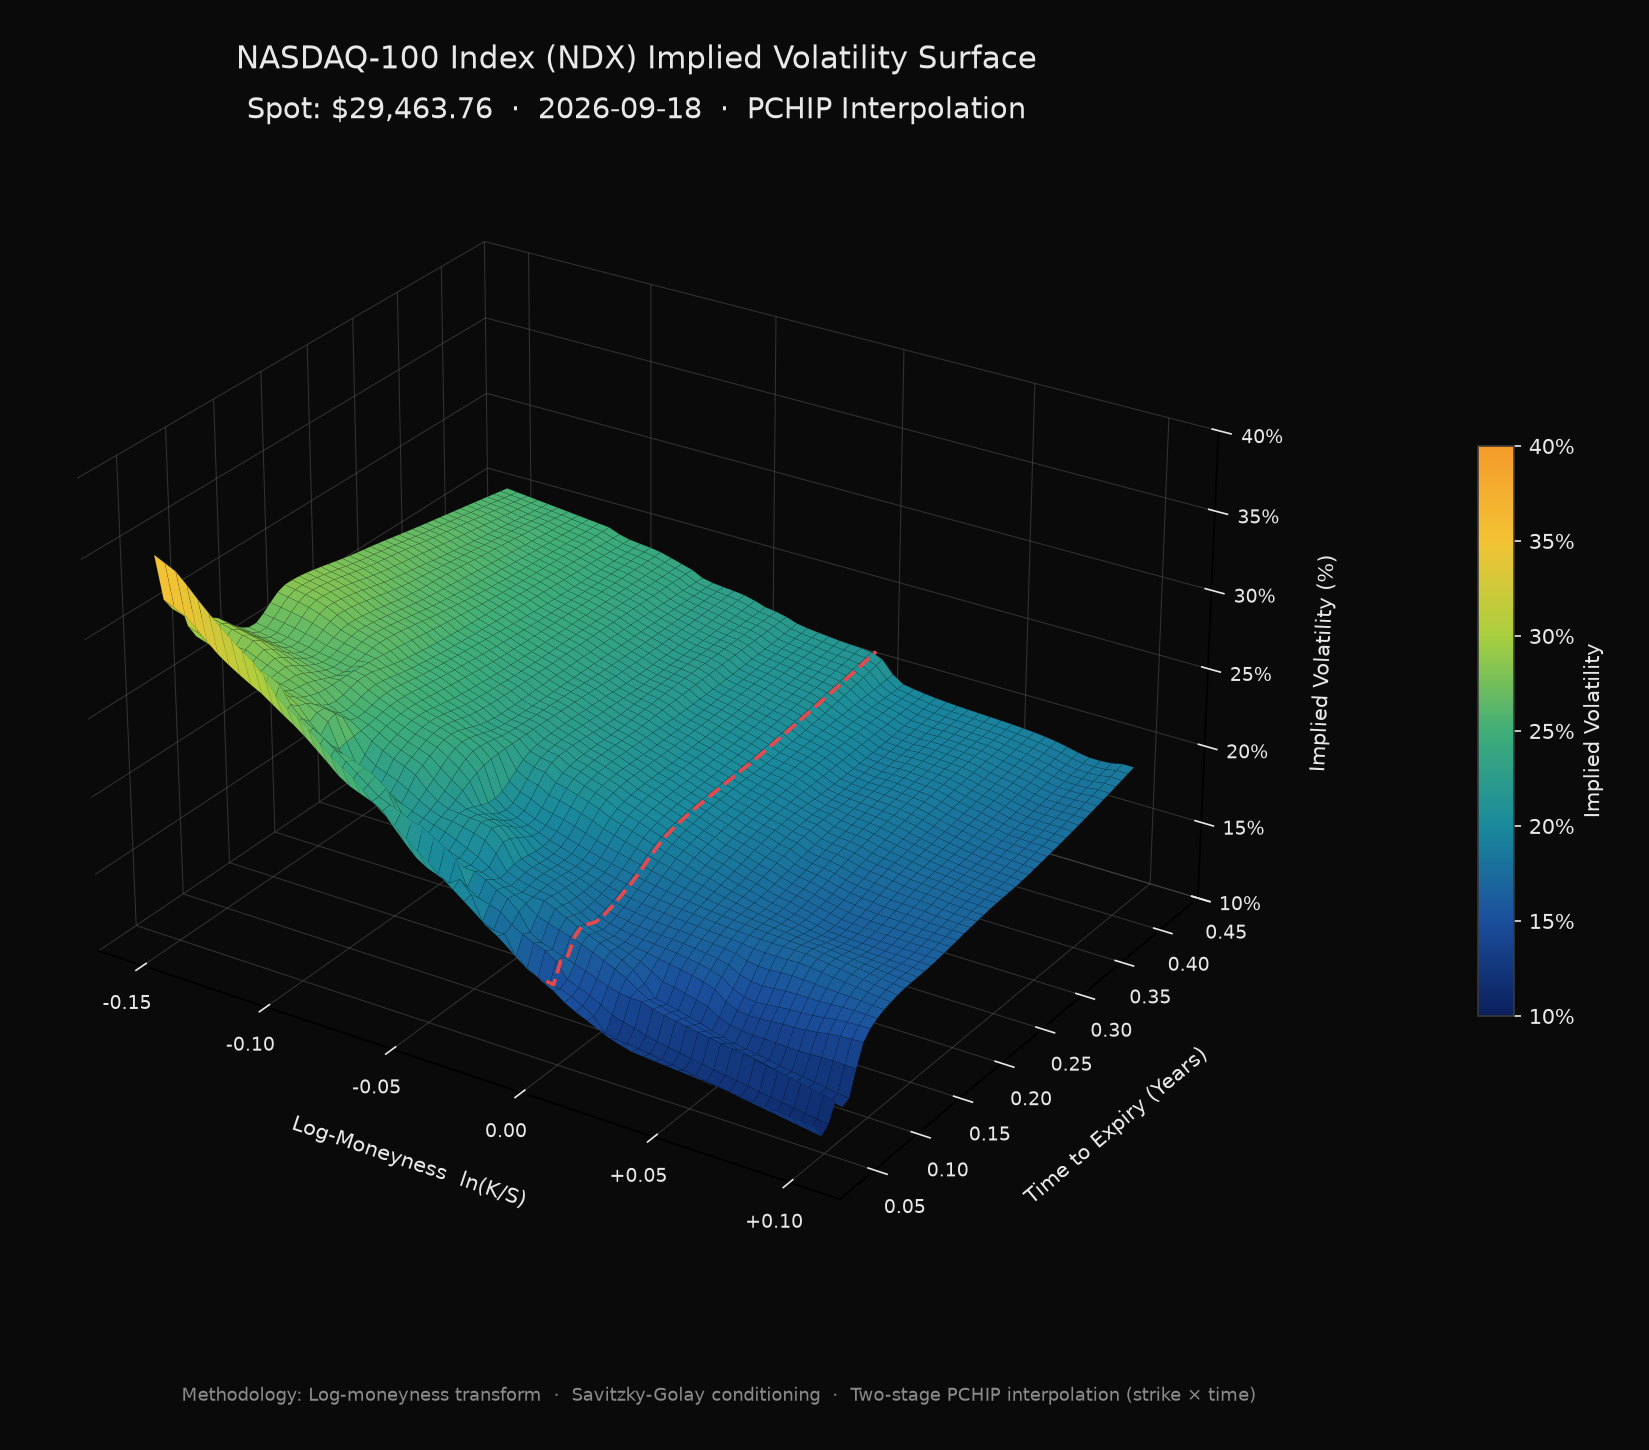
Generated with python -m pricer surface NDX. Same pipeline, static picture for slides.
HW 1 sanity checks
From the slide: “If one fails, stop and find out why.” These run live against your current inputs.
Loading guide…